Appearance
Monitoring
Monitor the health of your airport's data feeds and get notified when issues arise.
TIP
Don't see Monitoring in your dashboard? Reach out on Slack or email support@flyfruition.com to enable this feature for your airport.
Overview
The Monitoring system allows you to:
- Track data source health for TSA wait times, flight data, WordPress sync, and more
- Set up alerting with independent thresholds and notification channels per data source
- View system health across your API server, Elasticsearch, and AWS CloudWatch
- Review flight reporting with daily summaries, on-time rates, and delay tracking
- See airline coverage to understand which carriers are included in your data feeds
Monitoring Dashboard
The Monitoring Dashboard provides a real-time view of your data sources and system health.
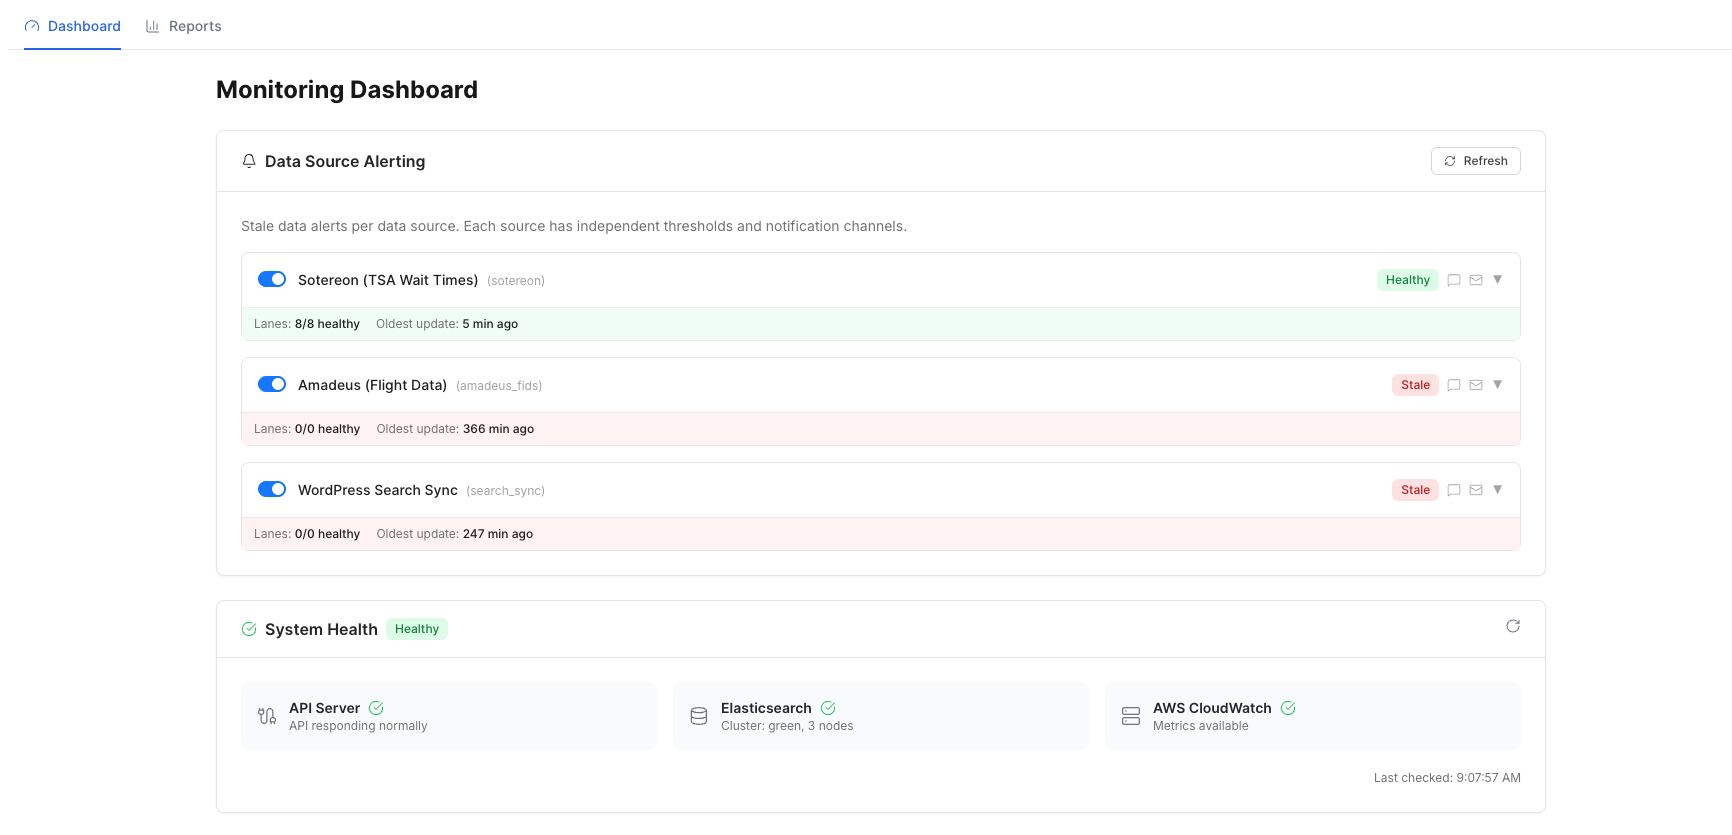
Data Source Alerting
Each data source is monitored independently and displays its current health status. You can configure thresholds and notification channels for each source.
Monitored data sources include:
- TSA Wait Times - Tracks health and last update time for TSA data
- Flight Data - Monitors flight feed connectivity and freshness
- WordPress Search Sync - Tracks the status of content syncs from WordPress
Each data source shows:
| Detail | Description |
|---|---|
| Status | Current health — Healthy, Degraded, or Down |
| Errors | Number of errors in the current monitoring window |
| Last update | How recently the data source was refreshed |
INFO
Click Refresh to manually check the latest status of all data sources.
System Health
The System Health section provides an at-a-glance view of your core infrastructure:
- API Server - FlyFruition API availability and uptime
- Elasticsearch - Search engine cluster status and health
- AWS CloudWatch - Cloud monitoring metrics and availability
Each system shows its current status along with a timestamp of the last health check.
Reporting
The Reporting section gives you a detailed breakdown of flight data flowing through your feeds.
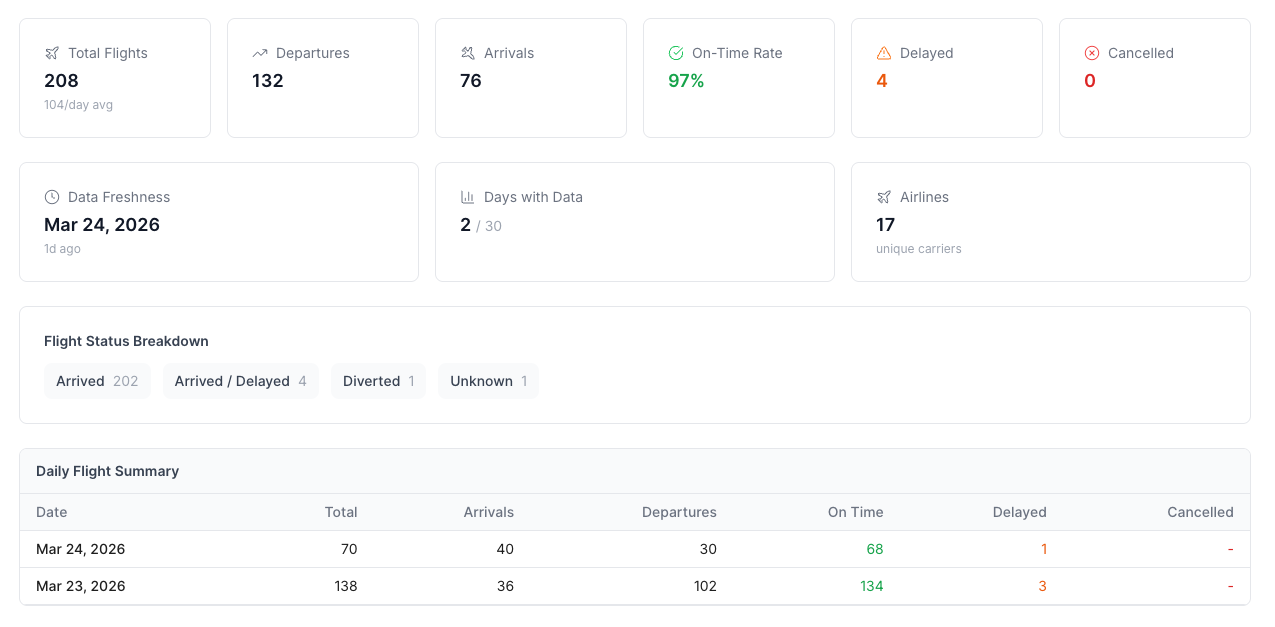
Flight Statistics
At-a-glance metrics for your airport's flight activity:
- Total Flights - Total number of flights with a daily average
- Departures - Number of outbound flights
- Arrivals - Number of inbound flights
- On-Time Rate - Percentage of flights arriving or departing on time
- Delayed - Number of delayed flights
- Cancelled - Number of cancelled flights
Data Freshness
Tracks how current your flight data is:
- Data Freshness - Date of the most recent data update and how long ago it was refreshed
- Days with Data - Number of days with available data out of the total tracking window
- Airlines - Number of unique carriers in your feed
Flight Status Breakdown
A summary of flight statuses across your data:
- Arrived - Flights that have landed
- Arrived / Delayed - Flights that arrived but were delayed
- Diverted - Flights redirected to another airport
- Unknown - Flights with an undetermined status
Daily Flight Summary
A day-by-day table showing:
| Column | Description |
|---|---|
| Date | Calendar date |
| Total | Total flights for the day |
| Arrivals | Number of arriving flights |
| Departures | Number of departing flights |
| On Time | Flights that were on schedule |
| Delayed | Flights that experienced delays |
| Cancelled | Flights that were cancelled |
TIP
Use the Daily Flight Summary to spot trends in delays or cancellations that may indicate issues with a specific data feed or carrier.
Airline Coverage
The Airline Coverage section shows which airlines are included in your flight data feeds.
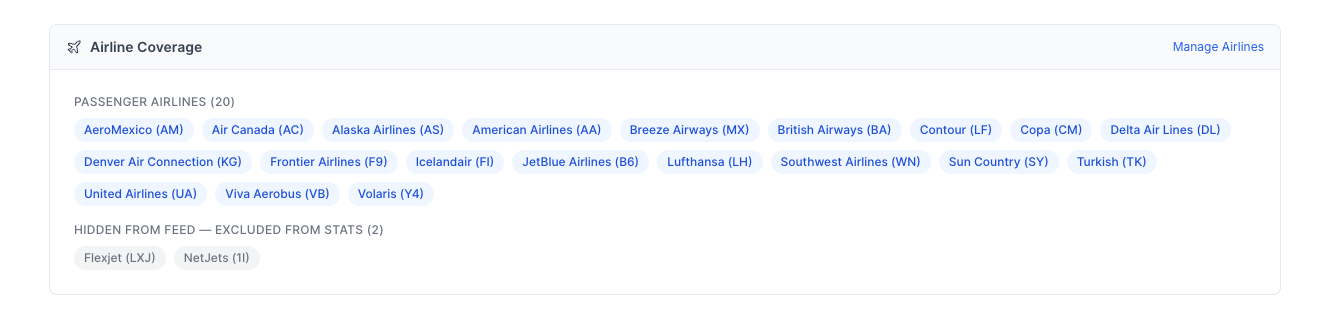
Passenger Airlines
Lists all passenger airlines currently being tracked, displayed with their name and IATA code (e.g., American Airlines (AA), Delta Air Lines (DL)).
Hidden from Feed
Airlines that are excluded from reporting statistics. These are typically non-passenger carriers such as charter or private jet operators (e.g., Flexjet, NetJets).
INFO
To manage which airlines are included or excluded, click Manage Airlines in the top-right corner of the Airline Coverage section.